The Nevada Workers Compensation Chronicle is a newsletter from the Department of Industrial Relations. Each quarter they send out important information as it relates to Nevada Workers
Compensation. Among this information, they pass along statistics from the CARDS system (Claims and Regulatory Data System).
This past year, they released two reports for the Winter and Spring seasons that show the top 5 nature of injuries and cause of injuries for workers comp claims filed during those periods. A breakdown is below:
Top 5 Nature of Injuries and Cause of Injury Workers’ Comp Claims:
For period 8/1/22-11/30/22
Top 5 Nature of Injury and Cause of Injury Workers’ Comp Claims
Patricia Barchus, Management Analyst I, WCS
Nevada Claims Processed in CARDS (Claims and Regulatory Data System) between August 1, 2022 and November 30, 2022:
TOP 5 ACCEPTED NATURE OF INJURY:
Percent of Total Reported
1. Strain or Tear 26.44%
2. Laceration 13.16%
3. Sprain or Tear 11.72%
4. Contusion 10.44%
5. Puncture 6.46%
TOP 5 ACCEPTED CAUSE OF INJURY:
Percent of Total Reported
1. Lifting 7.46%
2. Fall, Slip or Trip, NOC 6.19%
3. Strain or Injury By, NOC 5.94%
4. Object Being Lifted or Handled 5.84%
5. Falling or Flying Object 4.55%
For period 12/1/22-2/28/23
Top 5 Nature of Injury and Cause of Injury Workers’ Comp Claims
Patricia Barchus, Research and Indexing Coordinator, WCS
TOP 5 ACCEPTED NATURE OF INJURY:
Percent of Total Reported
1. Strain or Tear 26.52%
2. Sprain or Tear 12.73%
3. Laceration 12.05%
4. Contusion 11.91%
5. Puncture 6.09%
TOP 5 ACCEPTED CAUSE OF INJURY:
Percent of Total Reported
1. Fall, Slip or Trip, NOC 8.18%
2. Lifting 6.23%
3. Strain or Injury By, NOC 5.73%
4. Object Being Lifted or Handled 5.17%
5. On Ice or Snow (fall, slip, or trip) 4.48%
Fatal vs. Non-fatal
The Survey of Occupational Injuries and Illnesses (SOII) and the Census of Fatal Occupational Injuries (CFOI) are conducted by the Bureau of Labor Statistics (BLS) with participating states under a
Federal/State cooperative program.
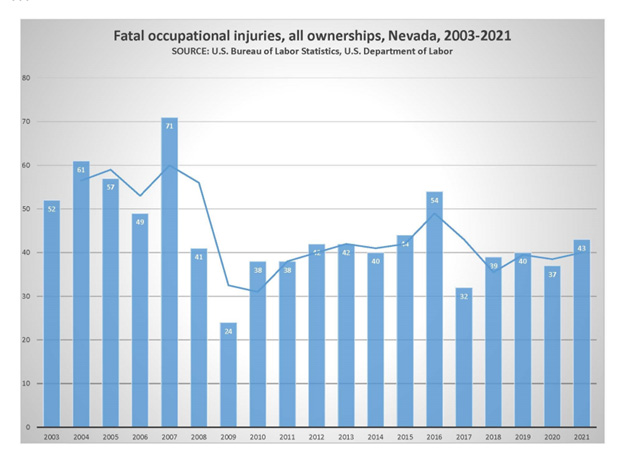
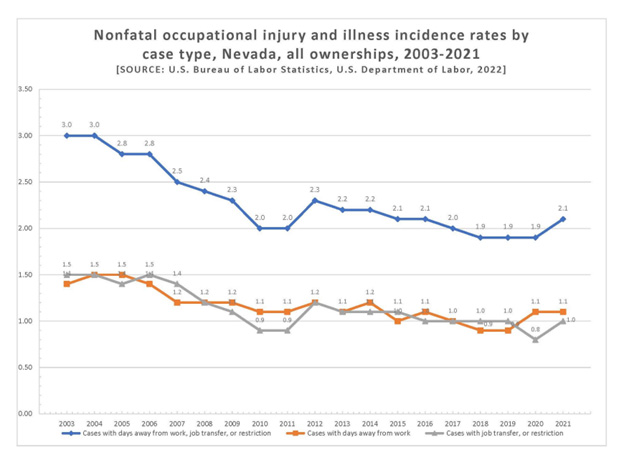
The data tables below show compiled statistics from 2003 – 2021, reflecting the numbers of fatal occupational injuries and nonfatal occupational injury and illness incidence rates by case type and by
year for all ownerships in Nevada.


